Remote debugging
Pieter PInstalling gdbserver to the Raspberry Pi
The toolchain includes a tool called gdbserver. This program
will run on the Raspberry Pi, and we'll connect to it using gdb
on our computer. First install gdbserver to the Pi:
scp ~/opt/x-tools/armv6-rpi-linux-gnueabihf/armv6-rpi-linux-gnueabihf/debug-root/usr/bin/gdbserver RPi0:~ssh RPi0 sudo mv gdbserver /usr/local/binssh RPi0 gdbserver --version GNU gdbserver (crosstool-NG UNKNOWN) 10.2 Copyright (C) 2021 Free Software Foundation, Inc. gdbserver is free software, covered by the GNU General Public License. This gdbserver was configured as "armv6-rpi-linux-gnueabihf"
Installing extra libraries to the sysroot
By default, Raspberry Pi OS preloads a custom memcpy implementation.
When debugging, GDB needs that library in the sysroot as well. Install it
using:
echo "deb http://archive.raspberrypi.org/debian/ buster main" | sudo tee /var/lib/schroot/chroots/rpizero-buster-armhf/etc/apt/sources.list.d/raspi.listwget -qO- https://archive.raspberrypi.org/debian/raspberrypi.gpg.key | sudo schroot -c source:rpizero-buster-armhf -u root -d / -- apt-key add -sudo sbuild-apt rpizero-buster-armhf apt-get updatesudo sbuild-apt rpizero-buster-armhf apt-get install raspi-copies-and-fills
This is not necessary when your Raspberry Pi runs Ubuntu, for example.
Installing GDB on your computer
To debug ARM devices, you need an ARM version of GDB.
The toolchain includes armv6-rpi-linux-gnueabihf-gdb that you
can use.
Alternatively, you can install the gdb-multiarch package
using:
sudo apt install gdb-multiarchRunning GDB manually from the command line
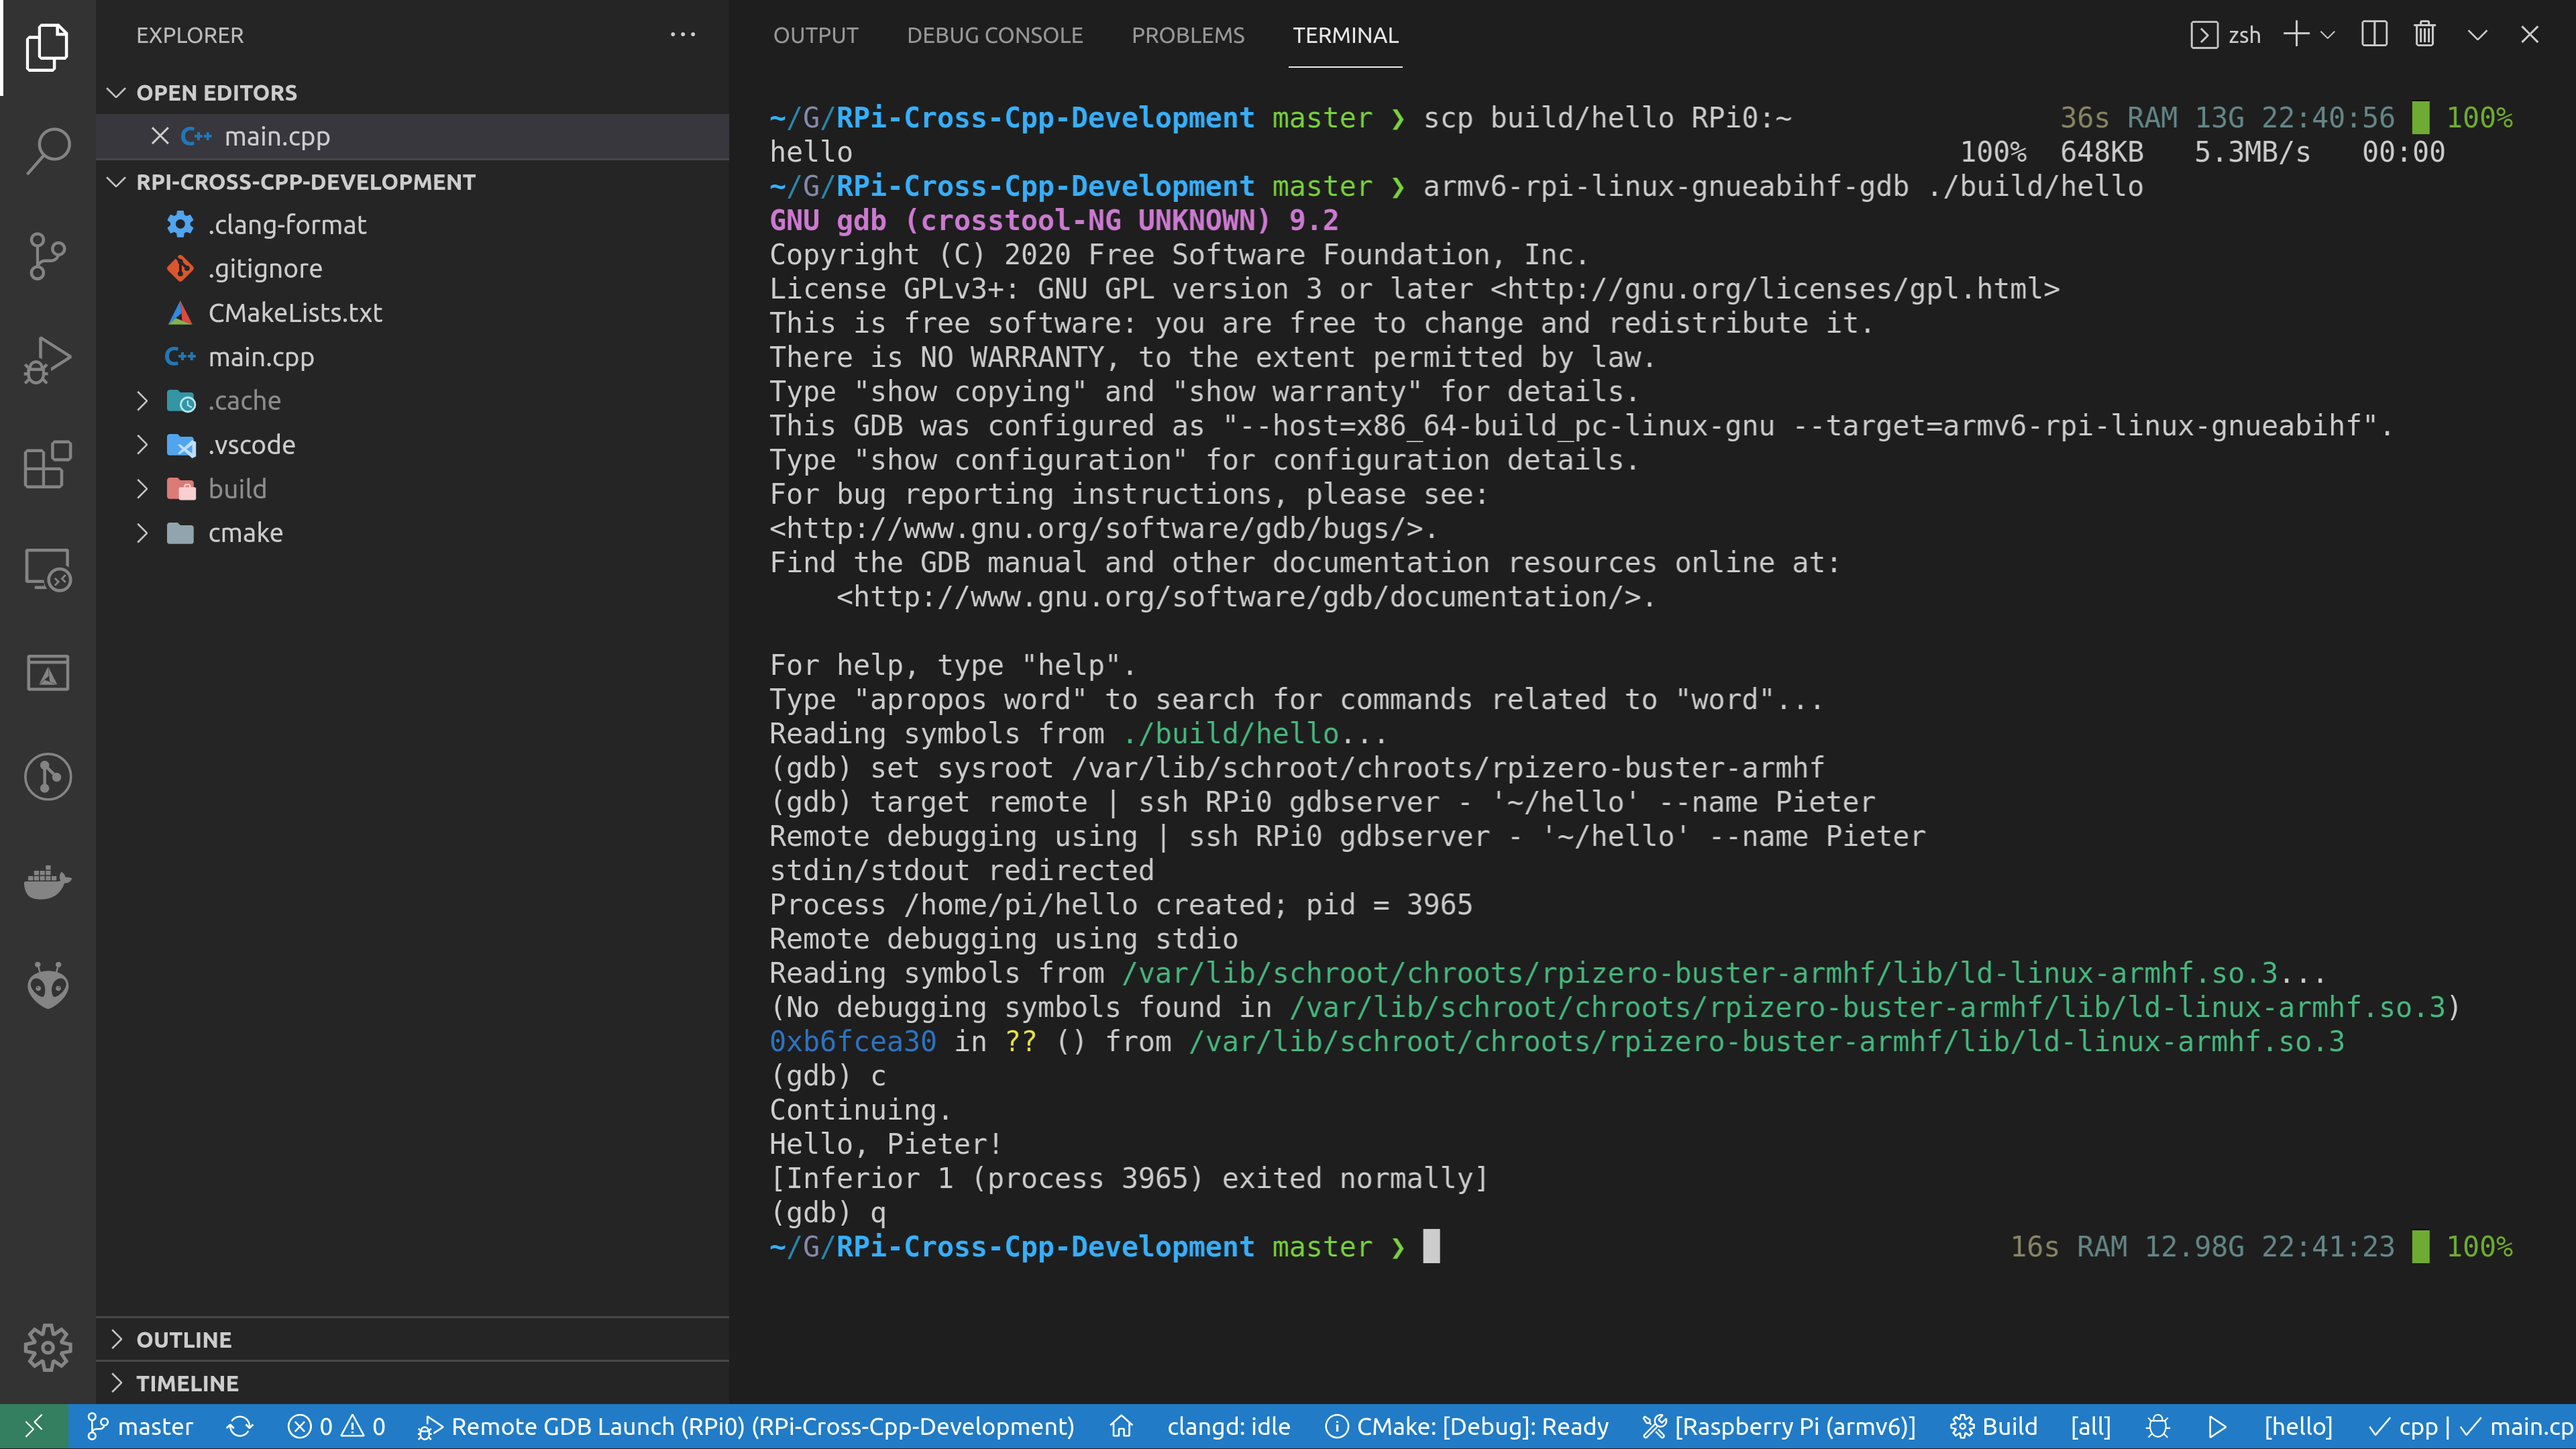
To make sure everything works correctly, let's start GDB from a command line and debug the program we compiled and copied to the Pi on the previous page:
armv6-rpi-linux-gnueabihf-gdb ./build/helloSet the sysroot and start gdbserver over SSH. Then type c or continue to run the program:
set sysroot /var/lib/schroot/chroots/rpizero-buster-armhftarget remote | ssh RPi0 gdbserver - '~/hello' --name Pietercontinue
Use q or Ctrl+D to quit GDB.
Debugging using VSCode
The example project includes task.json and launch.json
files that automatically copy the binary to the Raspberry Pi and start gdbserver
when you hit F5. This allows you to set breakpoints, inspect the
call stack and variables, and so on, like you would during a normal native debug session.
The “C/C++” extension by Microsoft is required for debugging support.
Before you start debugging, edit launch.json and edit the paths to the sysroot
as appropriate. You might want to edit the SSH configuration and destination path in
tasks.json as well.
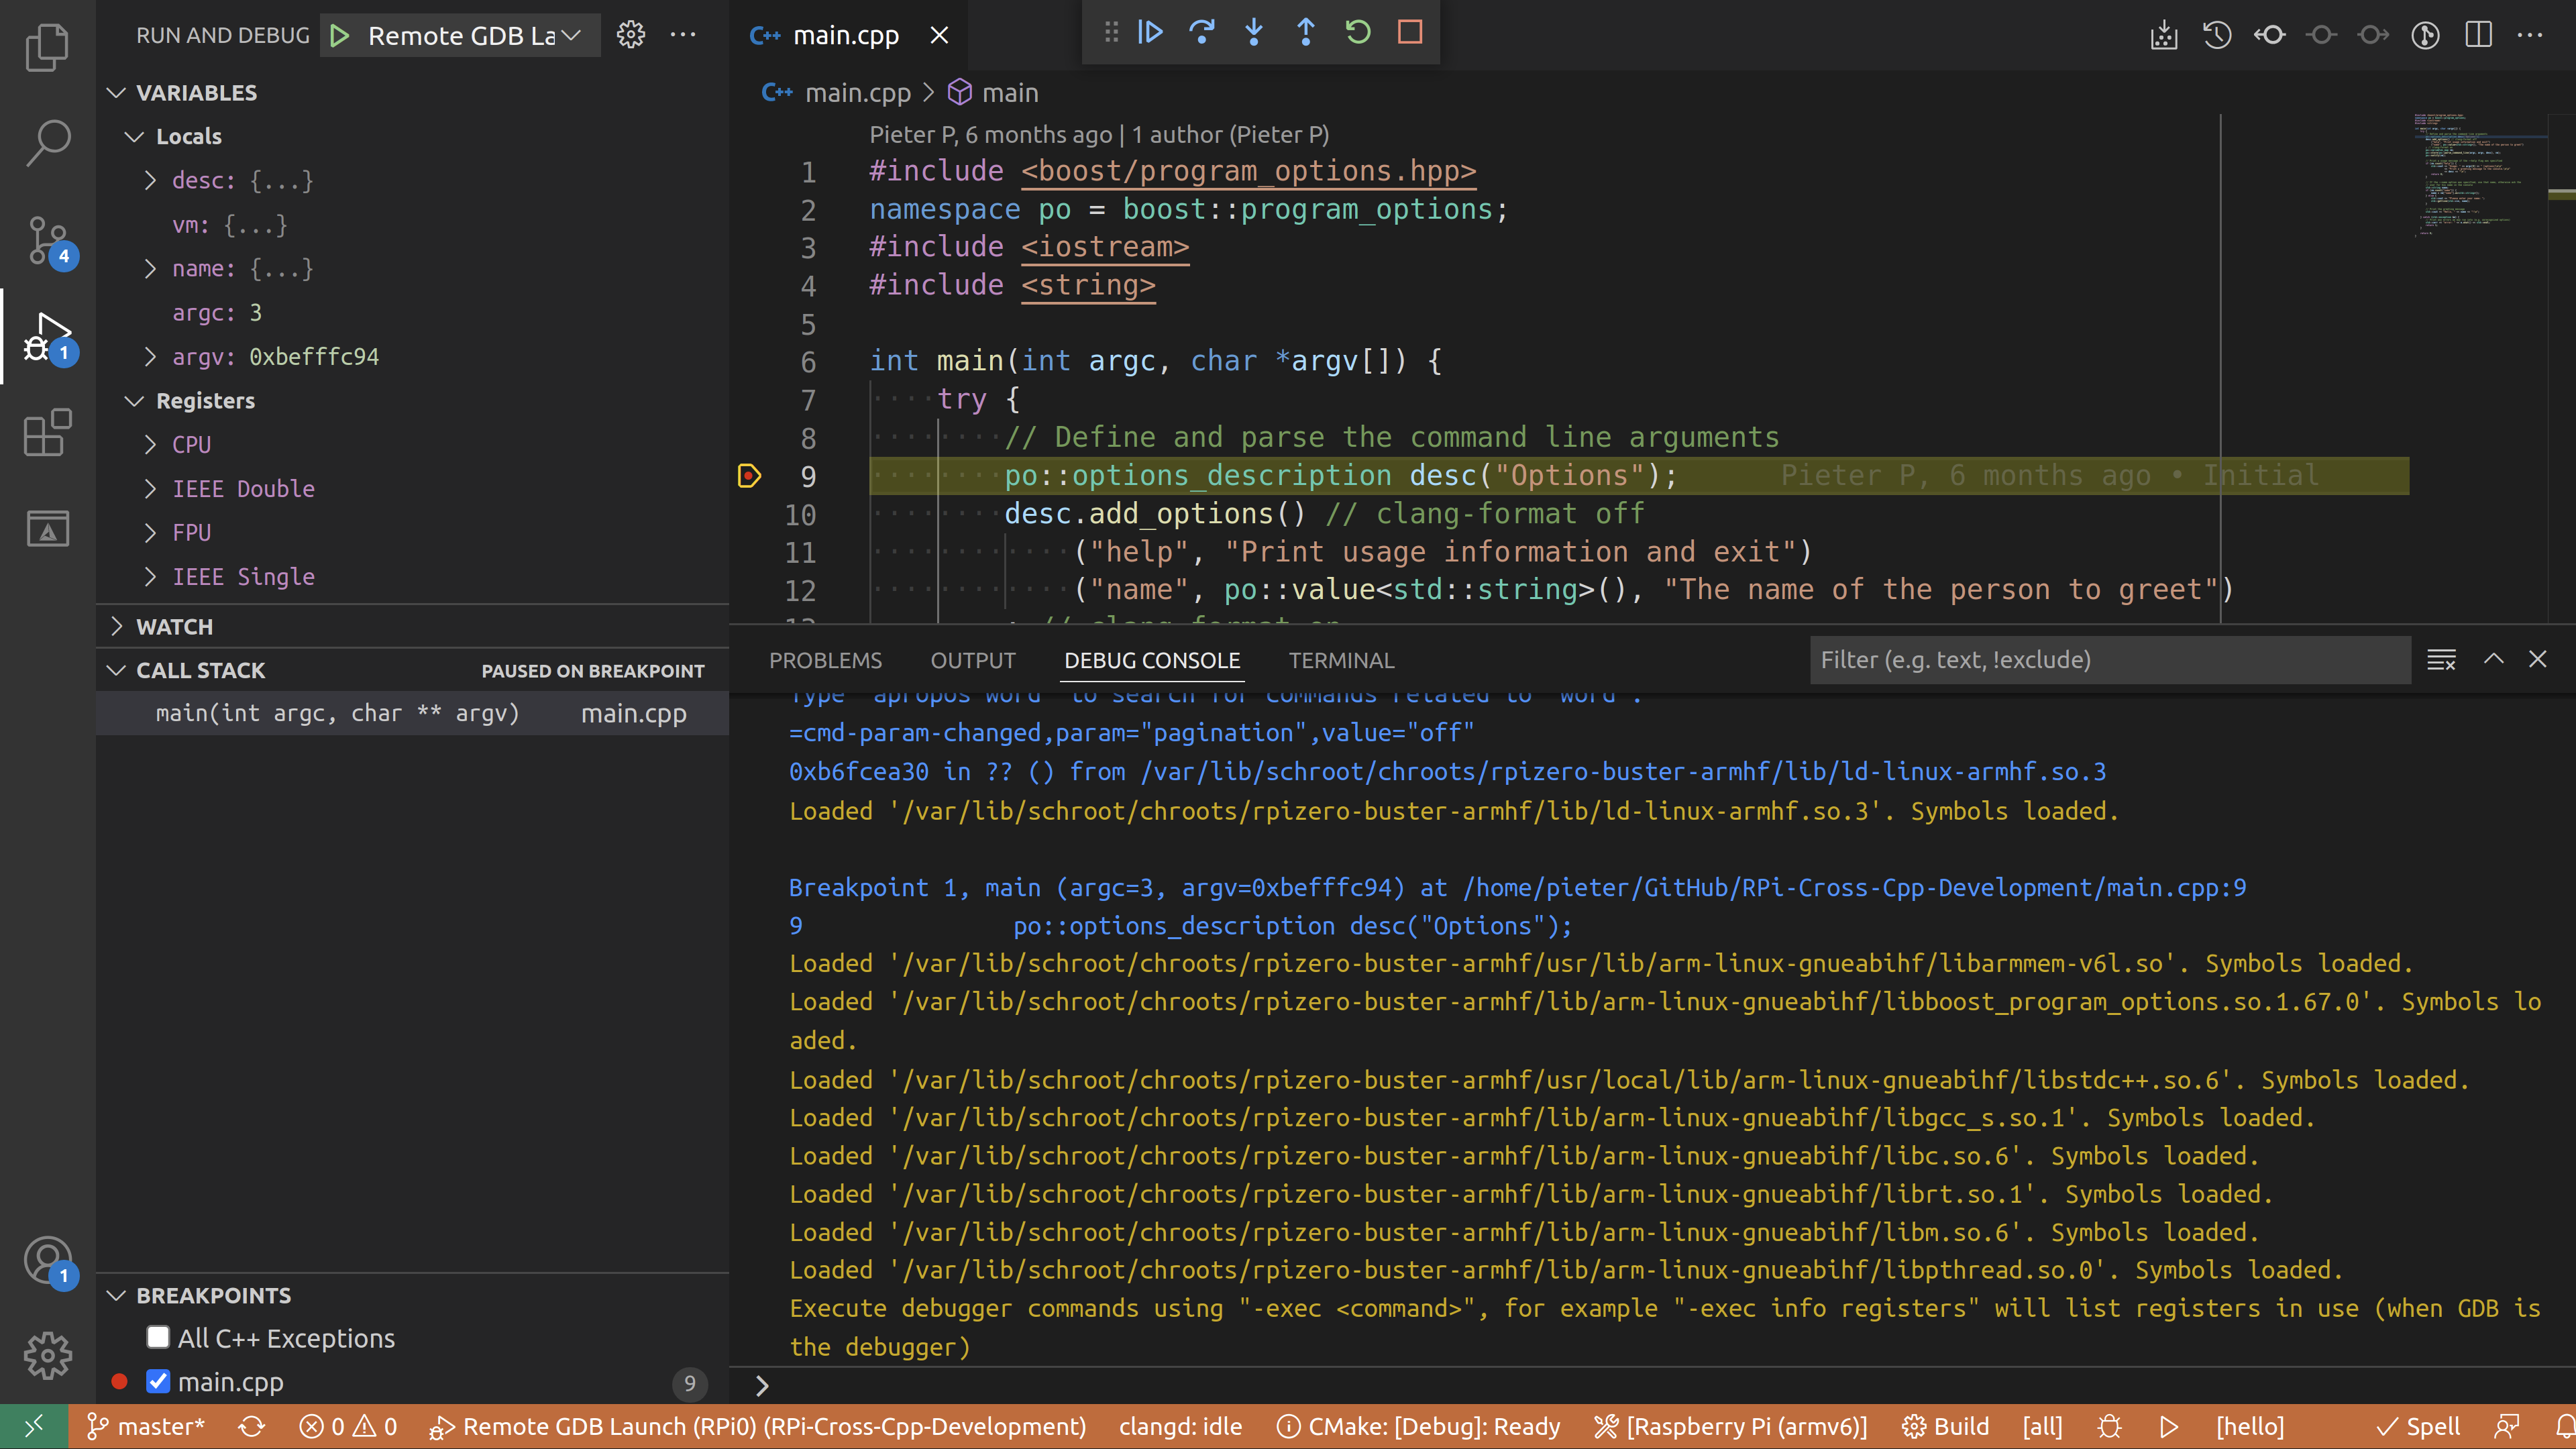
For some reason, the standard output of the program is not visible in VSCode.